Inserting the Microsoft Web Browser Object
Step 1: Open a blank spreadsheet and save it as [.xlsm] macro-enabled workbook
Step 2: Try inserting Microsoft web-browser Activex Control by following the below steps,
Refer to the below pictures for easy understanding
Step 2.1: Click the Developer Tab
Step 2.2: Click the Insert
Step 2.3: Click MoreTools under Activex Control (Last Control)
Step 2.4: Select Microsoft Web browser
Step 2.5: Click OK
Step 2.6: Draw a Rectangle for browser


you will get cannot insert Object error like this
 |
| Error Snip |
To fix this error you have to modify some registry settings.
1. Click Win + R to open Run
2. Type Regedit and click Enter to open the registry editor
3. Navigate to
Computer\HKEY_LOCAL_MACHINE\SOFTWARE\Microsoft\Office\ClickToRun\REGISTRY\MACHINE\Software\Wow6432Node\Microsoft\Office\16.0\Common\COM Compatibility\{8856F961-340A-11D0-A96B-00C04FD705A2}
4. Set the Dword to 0 from 400
5. Click OK ( Click Here for more details )

this will enable webbrowser object insertion
Now Close and Reopen the excel and Try inserting Microsoft web-browser Activex Control by above Pictures or Step 2 from the top
Now a WebBrowser is inserted to the excel sheet

Adding a Button and creating a macro for Opening Google


Step 1: Go to Developer
Step 2: Insert Button from form Controls
Step 3: Draw the button
Step 4: Right Click on Button and Click Assign Macro and Click New
Type the text insdide the macro:
Sub Button3_Click()
ActiveSheet.WebBrowser1.Navigate "http://www.google.com"
End Sub
Step 5: Save the macro and Click the button and now you can be able to see the google page and you can also perform some search.

Adding a Interactive poltly to excel
Step 1: Use the below python Code to generate a offline interactive plotly Graph
from plotly.subplots import make_subplots
import plotly
buttons = [ dict( method='update', label='b1', visible=True, args=[{'y':[1,2,3]}] ),
dict( method='update', label='b2', visible=True, args=[{'y':[30,20,10]}] )]
fig = make_subplots()
fig.add_scatter(x=[2,4,6], y=[1,2,3]) \
.update_layout(updatemenus=[{'buttons':buttons}]) \
.update_xaxes(range=[-10, 10]) \
.update_yaxes(range=[0, 30])
plotly.offline.plot(fig, filename='test5.html')
Step 2: After running the python code a file named test5.html will be generated on the same place where the python code exists
Step 3: Now we need to edit the generated html file manually to add compatiblity meta tag
Important Step
Open the html in notepad and add the <meta http-equiv="X-UA-Compatible" content="IE=edge" /> save and close the file
Originally generated HTML file from plotly looks like this
<html>
<head><meta charset="utf-8" /></head>
<body>
Modified HTML with browser compatibility
<html>
<head>
    <meta charset="utf-8" />
    <meta http-equiv="X-UA-Compatible" content="IE=edge" />
</head>
<body>
Step 4: Double click the file the html will be displayed in the browser

Step 5: Copy the link in the browser tab
file:///C:/Users/vignesh.rajendran/Desktop/test5.html
Step 6: Create one more form control button like we did for google above
Step 7: Assign a macro for it and type the macro code below
Sub Button4_Click()
ActiveSheet.WebBrowser1.Navigate "file:///C:/Users/vignesh.rajendran/Desktop/test5.html"
End Sub
Step 8: Save the macro and Excel
Step 9: Click the Button 4

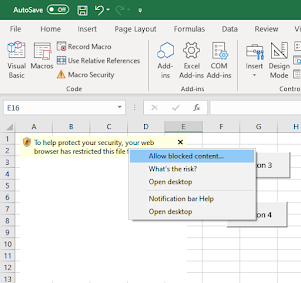
Step 10: Right Click on the ribbon and click allow blocked content

Step 11: Click Yes to run active Content

Now you can able to see the interactive plotly graph on the spreadsheet, Feel free to post a comment on your queries
Further Steps:
1. Rename the button and macros name like Open Google and Open Plotly
2. Resize the Browser window by Clicking the design mode under developer tab
3. Moving the buttons to desired positions
4. Try using a online plotly
5. Reset the Registry back to 400 to block the java script again
Hello! This is extremely helpful, thank you for putting this guide together. I know it's been almost 2 years since you created it, but I have a question: were you ever able to get an embedded plotly graph in Excel to properly display hover labels? I was able to insert a plot into Excel successfully, but the hover labels do not seem to work. Other interaction works, but only once I click in the web browser window.
ReplyDelete